Working with Web Performance at Studocu
2024-02-23
Disclaimer: This post has been originally written for Medium under the Studocu Tech team.
At Studocu, where we daily serve millions of users worldwide, we face the colossal task of catering to various devices and internet speeds. From high-end gadgets in busy metropolises to simpler devices in remote areas, our users — united in their goal of studying smarter — deal with our platform through vastly different lenses. In an ideal world, each of these interactions would be seamless from each other. However, in the one we live, we confront a stark reality: a pervasive digital divide that affects disproportionately especially the ones on the lower end of the technical spectrum. Web Performance Engineering is the discipline that shortens that gap and at Studocu, we don’t just recognize its importance but we champion it, understanding that enhancing our web performance is about equity and ensuring every student can have equal access to our educational resources.
What is Web Performance anyway?
Have you ever browsed through a website before loading it fully you click a button and nothing happens. Or you scroll until the part where you’re interested but then some delayed element loads above and pushes the desired content outside your view? In the realm of Software Engineering, performance usually implies speed and efficiency. Yet, when we delve into Web Performance, the concept becomes more nuanced than merely accelerating website load times. What exactly is Web Performance? Imagine it as the responsiveness that greets you after every click, swipe, or keystroke in a website — a seamless back and forth between action and feedback that often goes unnoticed when done right.
Historically, Web Performance was viewed as the speed at which a page loaded its textual and visual content. You can still find the events DOMContentLoaded and load available in browsers (if you don’t know their difference you’re not alone). This made sense for straightforward web pages with text, images, and basic links. Fast forward to today, and the digital landscape has changed drastically. Websites now resemble intricate ecosystems featuring dynamic elements like drag-and-drop interfaces, real-time validations, and multimedia content, making “speed” a multifaceted metric.
Google with its monopoly both as a search engine and a browser, decided to take a stance in the Web Performance debate and introduced in 2022 the Web Vitals. Their importance for the big-tech giant was such that three of them were elected to influence search rankings, the so-called Core Web Vitals: LCP (loading), INP (interactivity), and CLS (visual stability). At Studocu, while we adhere to these industry-standard metrics, our quest for excellence doesn’t stop there. We invest heavily in optimizing our databases and infrastructure, areas where Core Web Vitals can’t shine a light on, recognizing that true performance is a holistic pursuit.
You can't only trust lab data
In the quest for optimal web performance, distinguishing between lab data and field data is crucial. Lab data is derived from controlled tests on devices like your personal computer or a dedicated testing server. Although useful for initial assessments, its major drawback lies in the environment’s lack of variability — often failing to reveal the granular improvements or issues that can significantly affect user experience. This is particularly true in web performance, where every 100 milliseconds count. A classic pitfall is relying on Lighthouse reports generated in a browser as the definitive gauge of user experience, overlooking the diversity of real-world conditions.
Contrastingly, field data — gathered from real user monitoring (RUM)—offers a window into the authentic experiences of users across the globe. This data, collected from several interactions of users with the site, incorporates a variety of conditions including device types, browsers, locations, and internet speeds, painting a comprehensive picture of actual performance. When utilizing RUM, we collect information such as the User-Agent, location, and connection quality — always ensuring user anonymity and privacy are paramount, adhering to standards like GDPR.
The richness of field data allows us to identify patterns, trends, and issues that are invisible in a lab environment. For instance, analyzing field data might reveal that users in a particular region experience slower load times, prompting targeted optimizations that lab tests would never suggest. Lab data, on the other hand, especially coupled with our CI/CD pipelines, can help us quickly gather feedback or identify major performance changes when these occur.
Monitoring
For web performance engineers, the day begins with a dive into a comprehensive dashboard filled with graphs and metrics that paint a detailed picture of the site’s performance. This ritual isn’t just routine; it’s a critical part of our continuous effort to enhance user experiences. We meticulously analyze trends, dissect data, and uncover where the next leap in performance improvement might lie.
Our dashboards are more than just charts; they’re a lens into the health of our website, tracking everything from load times to user interactions across different geographies and devices. When a metric deviates from the norm, our automated systems trigger alerts, sending notifications through PagerDuty to swiftly address regressions.

However, the landscape of web performance is influenced by a myriad of factors, some within our control and others less so. Seasonal traffic spikes, infrastructure upgrades, global events, or even or even an innocuous library update can have unforeseen impacts on performance. Isolating these influences requires a detective’s mindset, employing a mix of analytical tools, historical data comparison, and sometimes a bit of intuition to trace the roots of a performance shift.
Running experiments
In previous articles, my colleague Killian has detailed our approach to A/B testing for product features. Similarly, we apply these principles to web performance enhancements, conducting experiments that introduce potential improvements to a subset of our users.
One successful experiment done by one of our teams tried out a different approach for loading database relationships on a given page. In this scenario, a new variant was tested against the Control one. After enough data was collected, we could see indeed the differences between them.
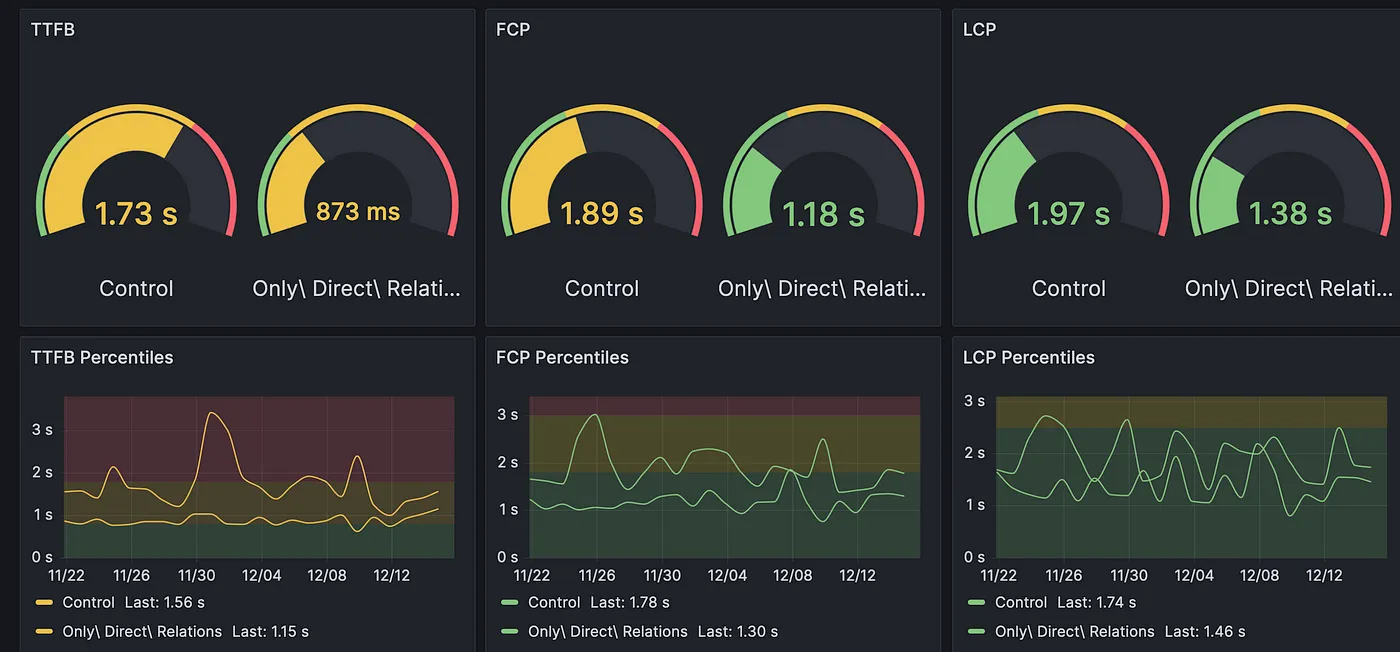
This methodical approach allows us to precisely measure the impact of changes while also controlling for external variables or ‘noise’ that might distort our findings.
For instance, consider the challenge of reducing TTFB (Time to First Byte). During another experiment, we directed our improvements to 50% of our user base, coinciding with an infrastructure upgrade designed to increase server capacity. Without isolating our experiment’s effects from these concurrent changes, we risked misattributing the observed performance gains to our optimizations rather than the infrastructure enhancements.
Despite the best intentions, not all experiments lead to the outcomes we anticipate. In such cases, the real value lies in the learnings we gather, which inform our subsequent efforts and strategies. For example, an experiment that aimed at retrieving cached assets faster with the Service Worker proved to be slower than just resorting to HTTP cache. This outcome prompted us to look deeper into our caching strategies, leading to more tailored optimizations.
The cumulative impact of these experiments is significant, leading to measurable improvements in overall site performance. By systematically testing, learning, and iterating, we continue to enhance the responsiveness and efficiency of our platform, ensuring a better experience for all users, regardless of their location or device.
Tools
All of this wouldn’t be possible if there weren’t so many good tools out there to help us. Below I give you a list of a few we use, in no particular order:
- OpenSearch: our non-relational database for storing RUM data
- Grafana: for creating dashboards, visualizations, monitoring and alerts
- web-vitals package: for collecting Web Vitals data
- Treo.sh: for a nicer overview of the CrUX report
- WebPageTest: best aggregator of performance data from several sources and amazing waterfall charts of requests
Conclusion
Working on the web performance of a high-traffic website presents a unique blend of challenges and rewards. Through this post, I wanted to give you a glimpse of the often complex efforts that go into optimizing our platform. We hope this insight not only enlightens but also inspires you, whether you’re seasoned or have just started in the field of web performance.
Thank you for taking the time to read our story.